
Using real-time data and analytics to drive event success


RX’s Exhibitor Dashboard gives you clear and reliable insights into the value of your event participation by replacing guesswork with objective, real-time data and analytics. Discover how this powerful solution can elevate your performance at every stage of your event, turning learnings into actions that will improve your return on investment.
Demonstrating the value of trade show participation has always been an important goal for exhibitors. That’s why RX includes Exhibitor Dashboard in its Business Builder suite of digital offerings - a real-time, data-driven tool that helps you track and improve your event performance.
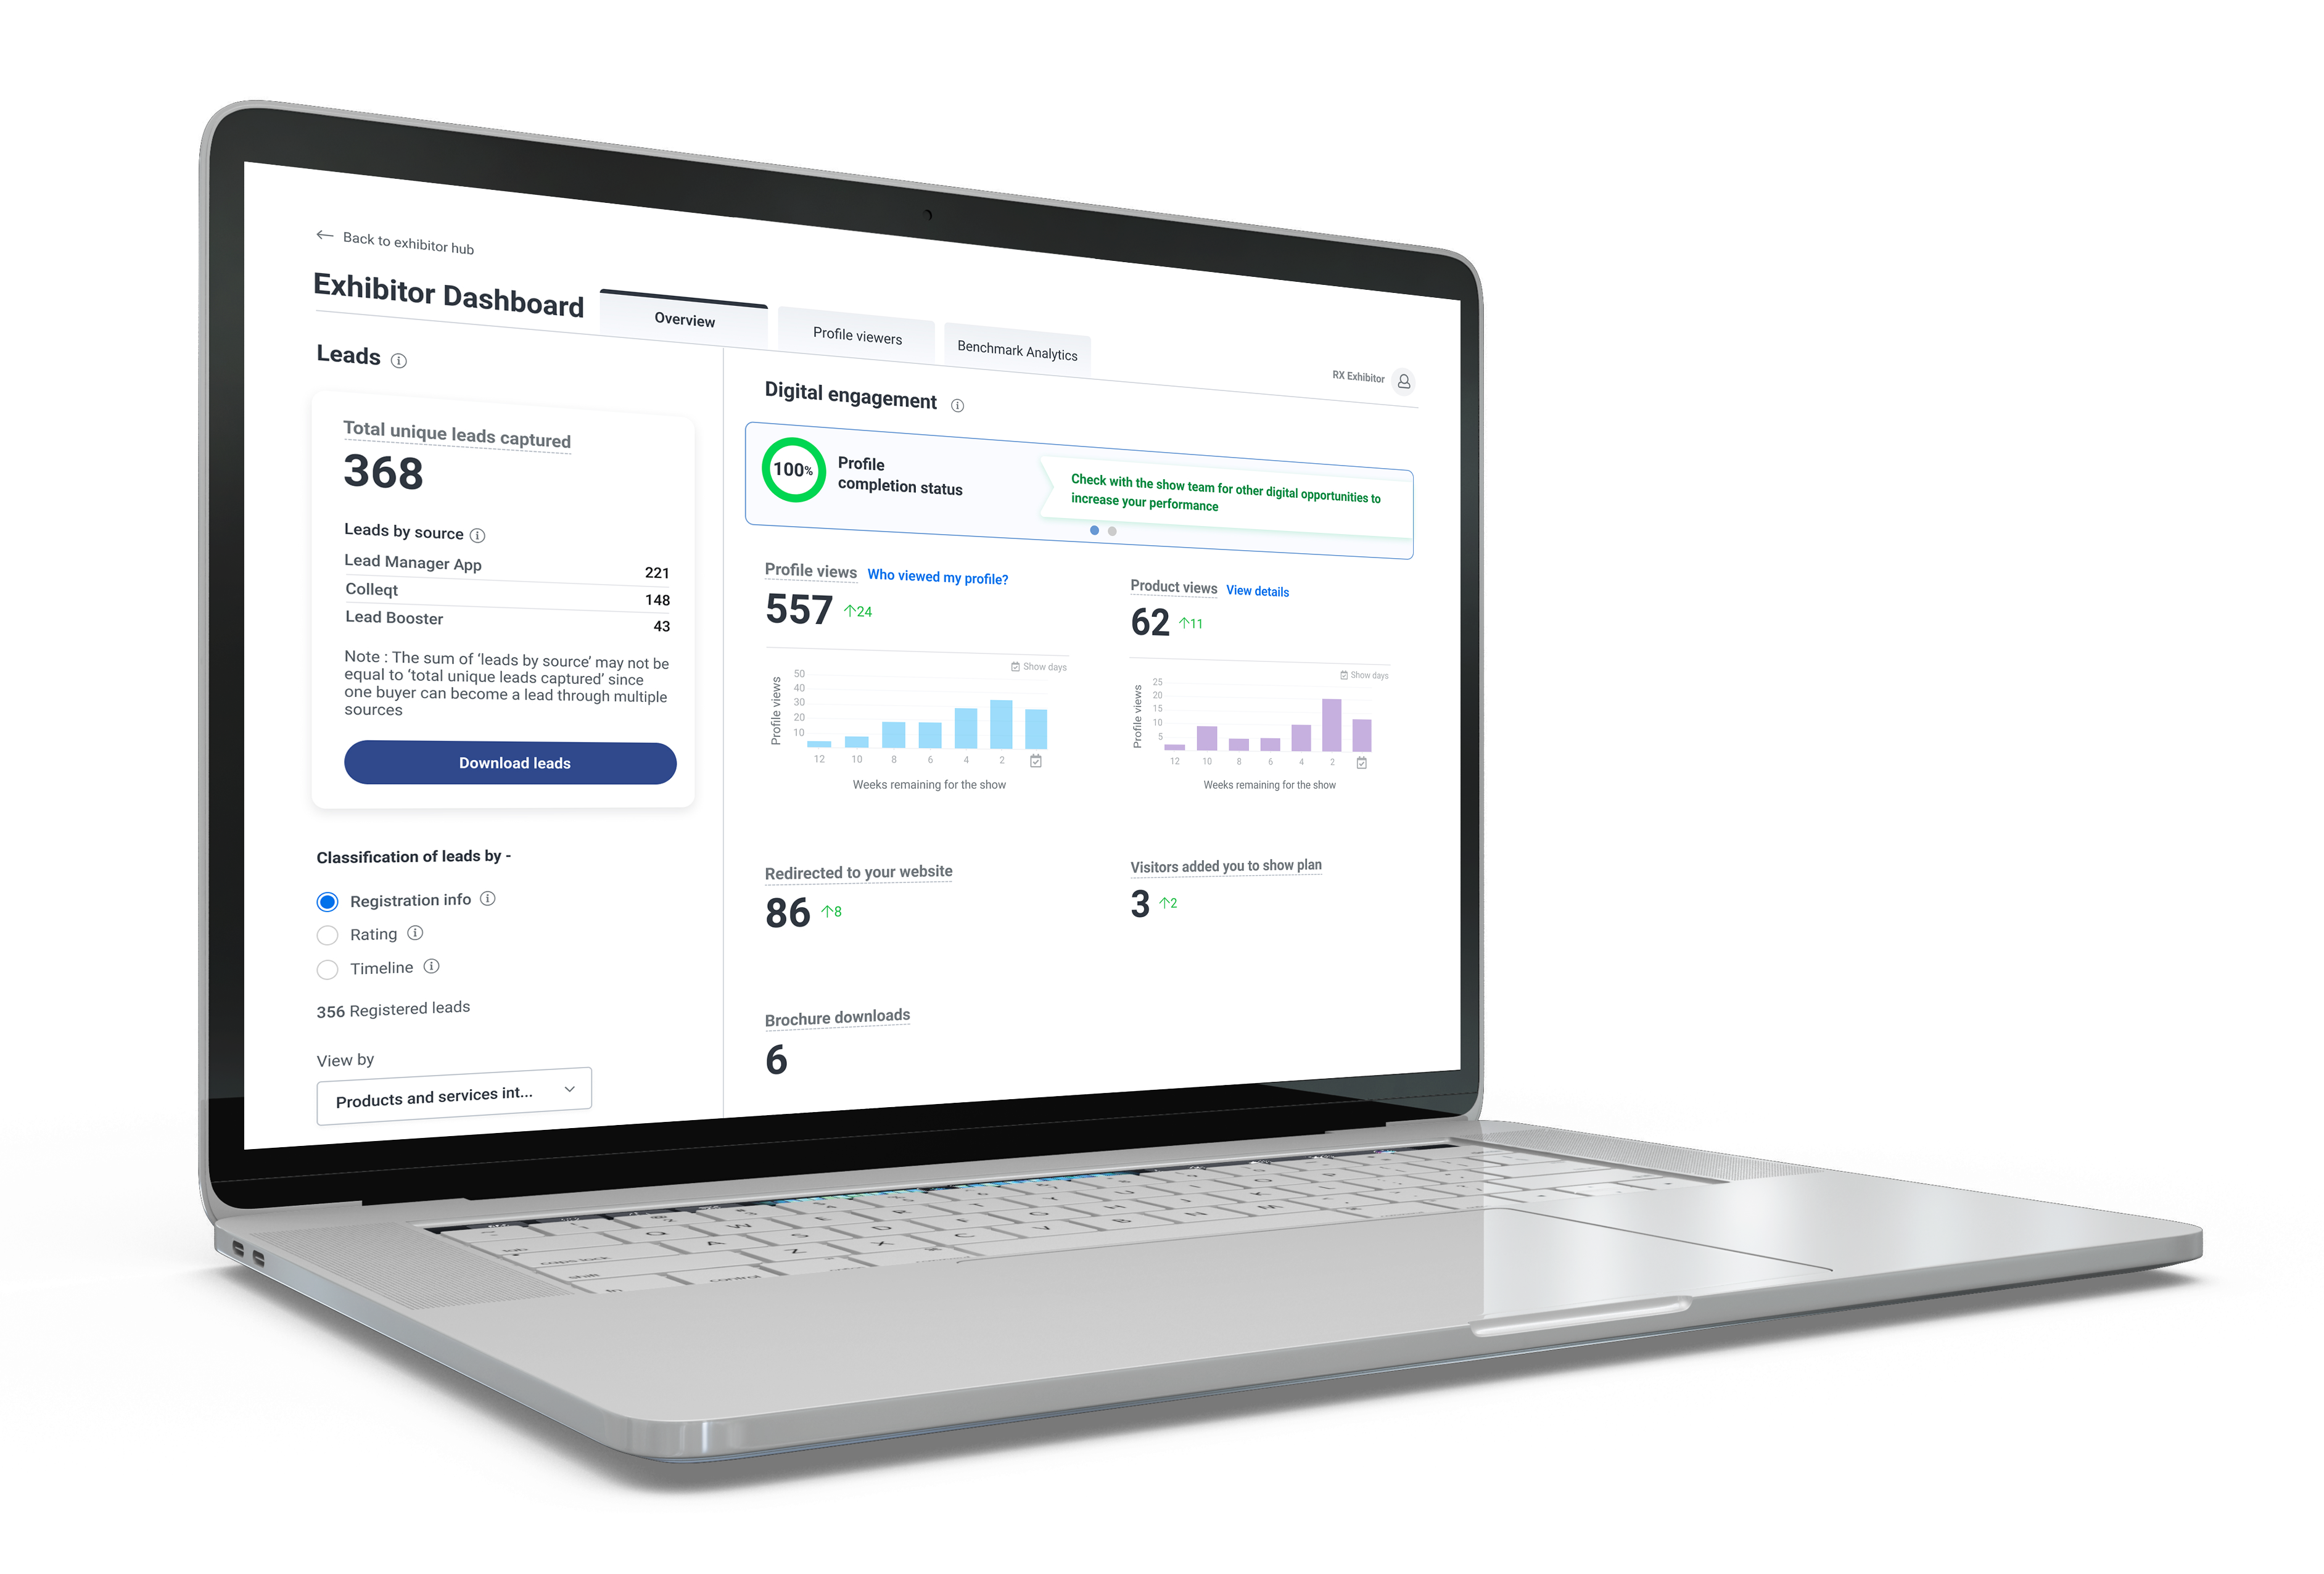
Exhibitor Dashboard brings together all your key event metrics in one place, including leads collected at the show, profile views, digital engagement and how many matchmaking recommendations were made (suggested by RX based on attendee registration preferences). This makes it easy to monitor how you’re performing and adjust your approach to get better results. After the event, you can use your lead data and analytics to prioritise your most promising prospects for follow-up, measure your ROI, and provide clear evidence of the value your participation delivered.
So, let’s take a closer look at how you can use it at every stage of your event participation to drive success.
Plan for maximum brand awareness and impact
In the lead up to the event, Exhibitor Dashboard can be used to inform your event marketing and show presence, increasing your visibility and boosting your chances of attracting more attendees to your booth.
Every exhibitor at an RX show is asked to complete a ‘profile’ for the online event directory. This is crucial, as RX data shows that 94% of attendees pre-plan their visit, often using Exhibitor Profiles to shortlist suppliers and products.
Exhibitor Dashboard makes it easy to see how complete your profile is and gives you reminders and tips to improve and promote your profile. 100% completion is the goal as completed profiles get 17 times more views than incomplete ones. Including product information, photos, videos, and brochure links, and selecting the most appropriate ‘categories’ for your business, are key to being viewed by more visitors and matched correctly to your target audience.
Monitoring your profile views and brochure downloads in the weeks leading up the event will help you to get the very most from your booth. An exhibitor at one of our recent events in Brazil decided which products to ship to the event based on those which generated the most views in their profile. Another exhibitor in Japan told us they used their product profile data to put their most in-demand products front and centre on their stand, and to decide which product specialists they should include in their event team. Our own data shows us that 38% of customers who download a brochure become a lead.
You can monitor the Matchmaking section to see how often your profile is getting recommended to attendees. And you can benchmark your performance against other companies in the same category to gain a broader perspective. If your performance is below the show average, you can consider adapting your approach to promote your brand and products further.
You can also use your profile as a testing ground to refine your event strategy. Experiment with keywords, product highlights, and visuals to identify what resonates with your audience. Then use your results to optimise your booth experience, focusing on your most popular offerings and ensuring your team is ready to engage effectively.
“Before the event even started, we confirmed visitors’ interests in our product launch through the results presented on the dashboard which was excellent. The numbers also confirmed that the event website is a great showcase for attracting potential customers.”


Monitor your event performance in real time
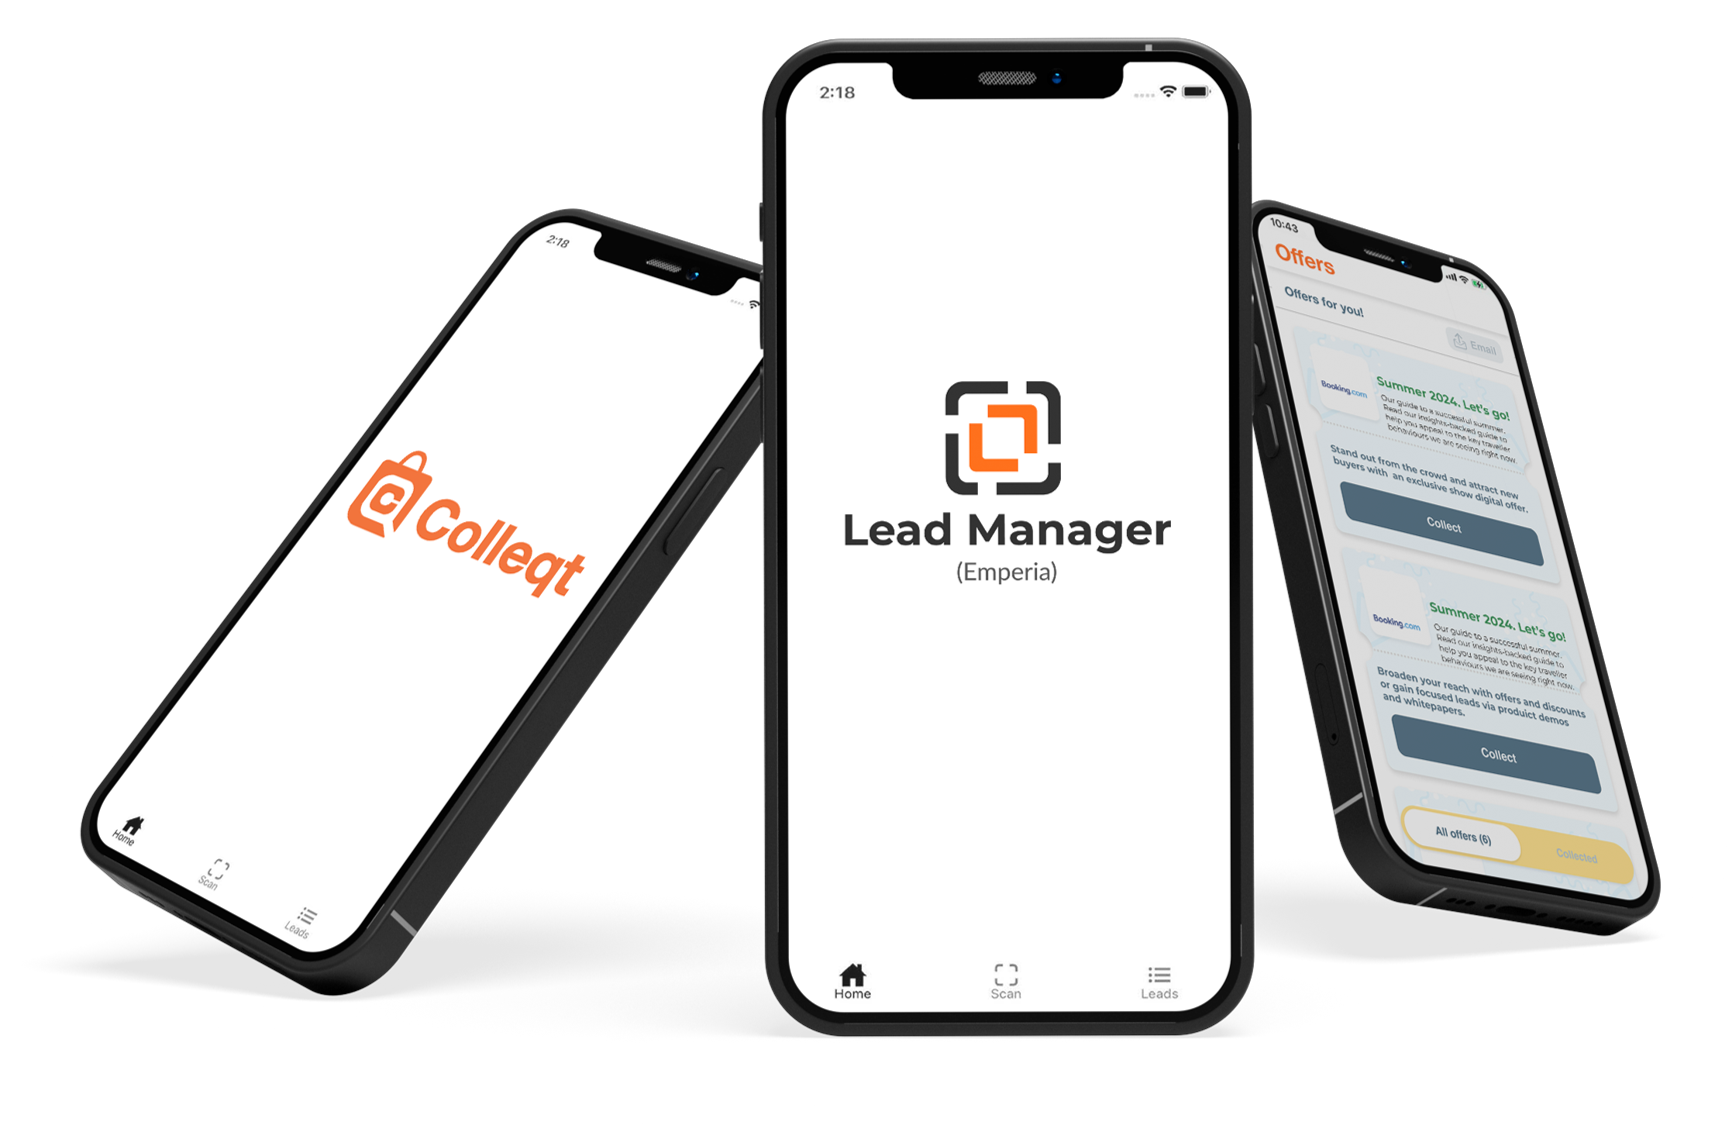
RX exhibitors enjoy exclusive access to three powerful lead generation services through our Business Builder solution, all of which can be monitored in real time on your Exhibitor Dashboard alongside your profile views and matchmaking recommendations.
Lead Manager App allows your booth team to scan visitor badges, collect accurate data, qualify leads on the go for faster follow-ups, and share brochures and contact details digitally and sustainably. Activation is required to use the app, and your dashboard will remind you if this is pending, as well as track whether your booth staff have logged in. You can view leads collected by individual team members, making it easy to spot performance gaps and incentivise staff with competitions or rewards. Your dashboard also provides data insights into your booth’s busiest times and key areas of product interest, helping you optimise your team’s focus for the next day.
Colleqt QR Code enables attendees to proactively scan QR codes placed around your booth to collect digital content in exchange for their contact details. Unlike standard QR codes, Colleqt QR Code captures valuable data such as names, job titles, company details, and product interests. This ensures you can generate leads even if you’re engaged with other clients or busy in meetings. By monitoring your scans in real time on your dashboard, you can ensure your QR codes are being used and determine if they need to be moved to a more visible or accessible place.
Lead Booster enhances engagement by alerting every registered visitor before and during the event to your incentive or giveaway,which we recommend they redeem at your booth. This approach not only increases your brand awareness ahead of the show, it also makes your booth a hotspot wherever it is located, ensuring maximum visibility of your offer amongst all attendees, not just those who happen to pass by your stand. Every visitor who claims your offer does so in exchange for their contact details and all these additional leads can be monitored in real time on your dashboard.
Analyse your results and improve your ROI
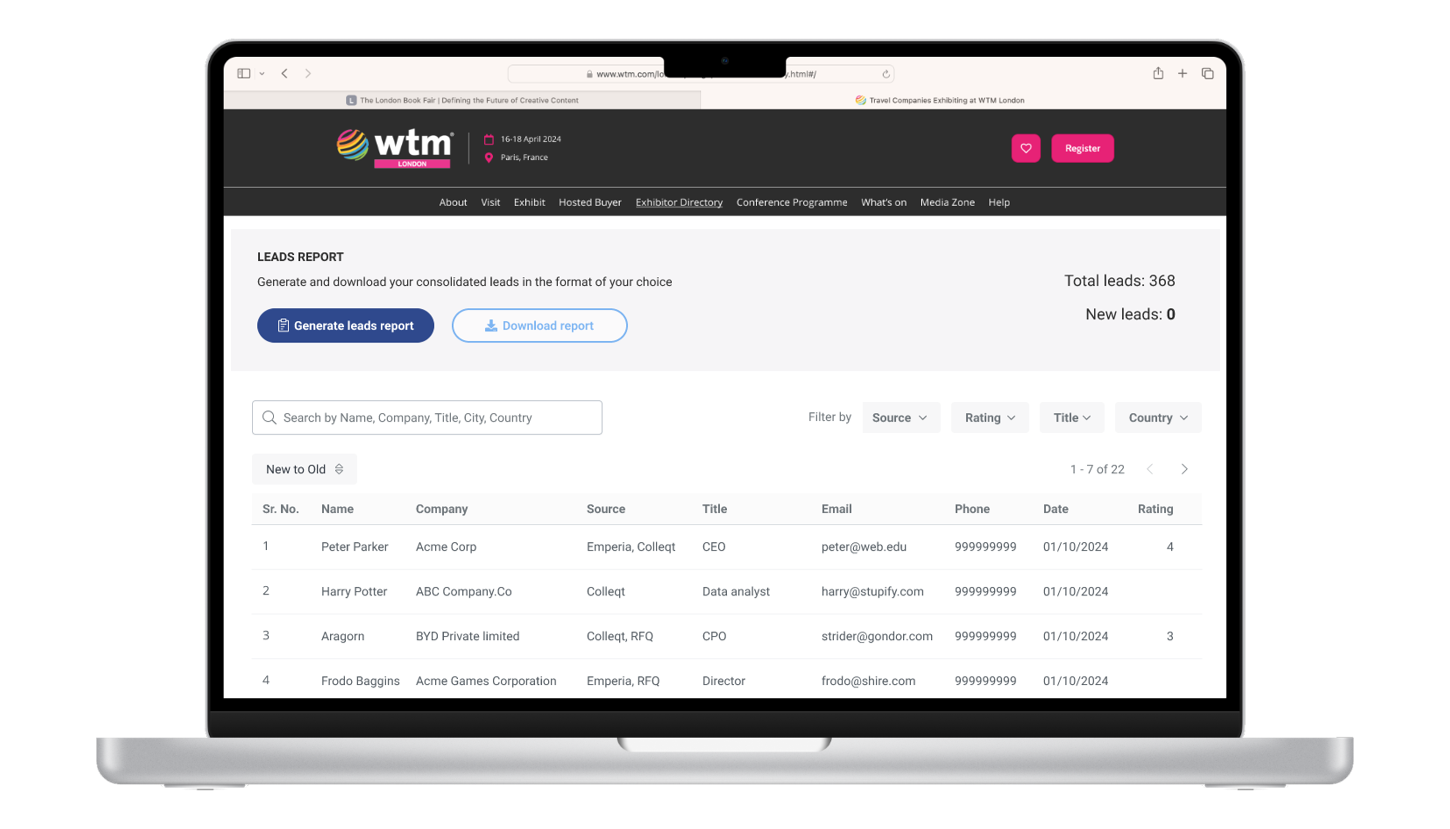
A reliable way of analysing event success has long been something of a holy grail for exhibitors. By consolidating all your face to face and digital leads, and brand exposure, in one place, Exhibitor Dashboard puts all the data you need at your fingertips so you can analyse and quantify your results. It also offers you key metrics to support decision making and justify your show investment.
Exhibitor Dashboard doesn’t just tell you how many unique leads were captured. It lets you sort and analyse them by source, rating, date, and salesperson, and download them as CSV files for seamless, error-proof CRM integration (no manual data input is required). This makes it easier to prioritise follow-ups by focusing on the most highly qualified leads first. You can drill further down on your leads to understand their job titles, business categories, product interests and demographics, helping you to craft targeted follow-ups that drive better outcomes.
The dashboard also tracks your digital engagement, showing which companies viewed your profile* (with a sample of viewers) and which products attracted the most interest. Additionally, you can see how many viewers were redirected to your website, added you to their show plan, or downloaded your brochures. These insights not only help you measure brand exposure but also reveal audience trends and preferences, which can inform your broader marketing strategy.
*Disclaimer. For privacy reasons, only the company name is provided for Profile Viewers, not personal contact details.
With Exhibitor Dashboard, tracking key metrics like leads, views, and downloads is easy, giving you a clear picture of how your event performed against your goals. And you can generate detailed reports to showcase your results, evaluate your ROI, and justify your investment with confidence.
But the real power lies in the insights. By diving into the data, you’ll gain a deep understanding of your target audience’s preferences and behaviour. Armed with this knowledge, you can refine your strategies, tailor your offerings, and deliver a more engaging experience - driving stronger customer connections and boosting conversions at your next event.
“Exhibitor Dashboard offered valuable insights that helped improve our overall performance. By analysing the data provided, we gained a solid understanding of our target audience’s preferences and behaviour. This knowledge enabled us to tailor our strategies and offerings, accordingly, resulting in improved customer engagement and conversion rates.”

Maximise the value of your trade show investment with the RX Exhibitor Dashboard. This smart solution provides essential data and insights before, during, and after your event, helping you make informed decisions and achieve real results. To learn more, connect with your event team today - and be sure to share the Exhibitor Dashboard with your marketing, sales, and analytics teams to get the most out of your event.